Tutorial 11 - Debug PL/pgSQL functions
This tutorial show, how to debug PL/pgSQL database function using KPoGre.
Requirements
KPoGre PL/pgSQL function debugger fronted depends from functionality on the database server side.
- You need PostgreSQL version 8.3 or newer
- PostgreSQL server must be installed with debugger options. See note !
- In posgtresql.conf, you must have something like:
shared_preload_libraries = '$libdir/plugins/plugin_debugger.dll'
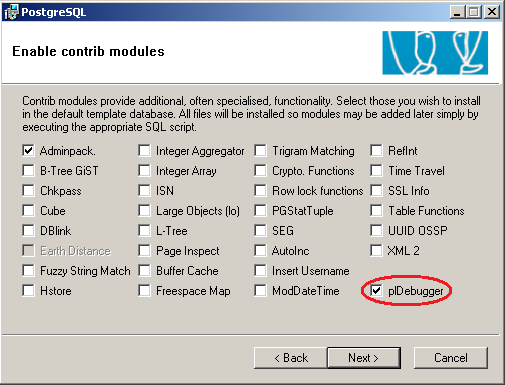
Note: On Windows You have two possibilites: One click installer
- but I can't get debugger to work with this (version 8.3.5). Rather, use pgInstaller msi package, where is
option to install debugging functionality.
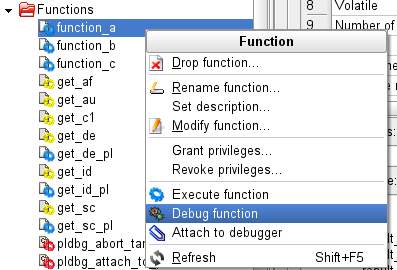
Open function Debugger
Select function you wish to debug in tree, make right mouse click to display menu and choose
![]() Debug function
Debug function
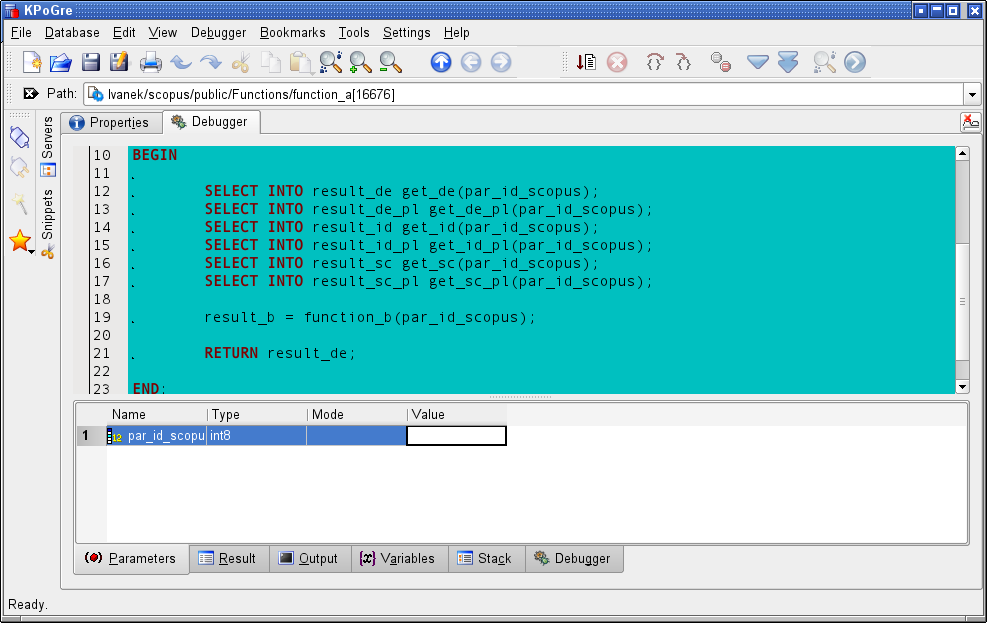
KPoGre shows Debugger. Also toolbar is displayed.
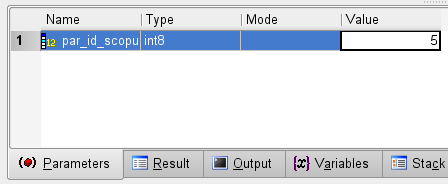
Function parameters
If function have any arguments, fill values to table. Convertion rules are the same as in Datatable.
Start debugging
Choose
![]() Debugger -> Start in debugger
Debugger -> Start in debugger
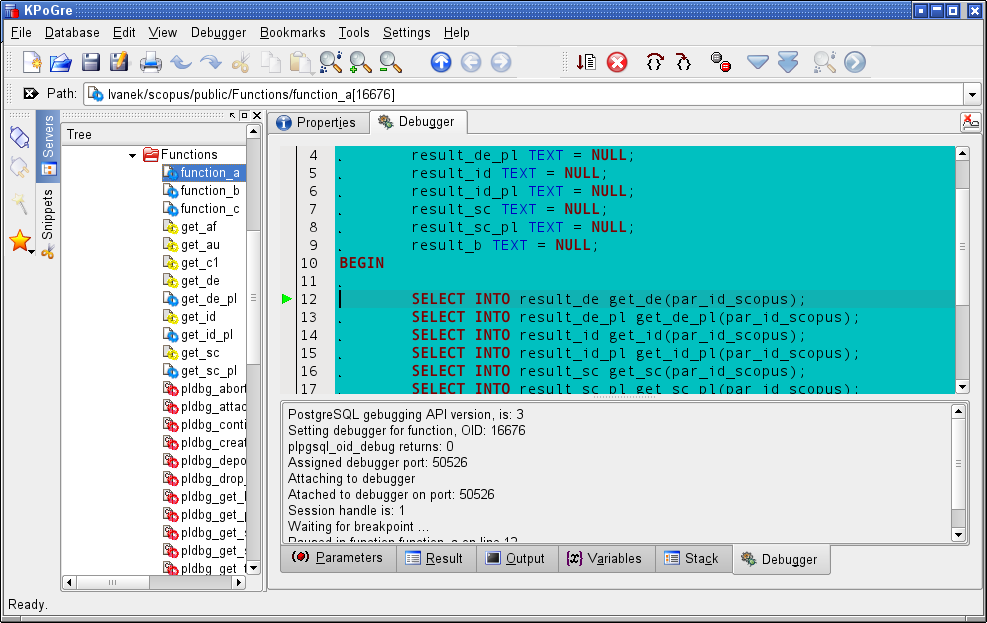
It is possible to cancel debugging using
![]() Debugger -> Stop
Debugger -> Stop
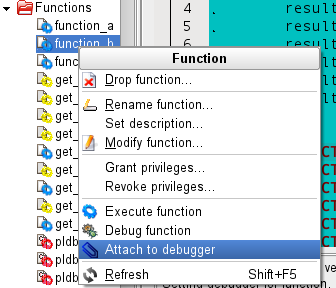
Ataching another functions
When debugger is started, its possible to attach another functions to it. It is necessary for Stepping into called function.
Breakpoints
When debugger is started, its possible to set or drop breakpoints. Place cursor to line,
where you want to toggle breakpoint, and use
![]() Debugger -> Toggle Breakpoint
Debugger -> Toggle Breakpoint
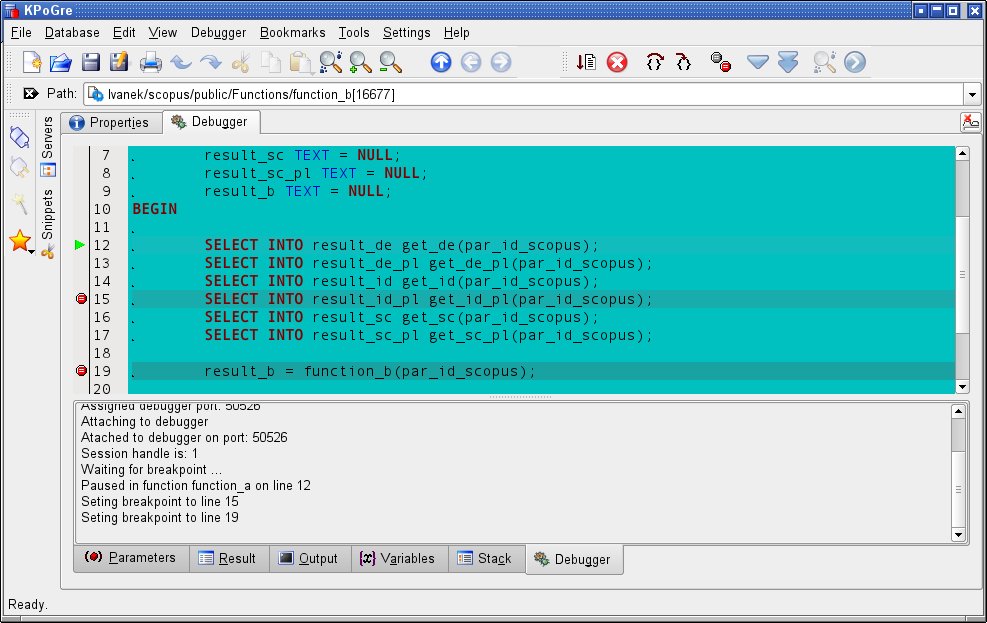
If breakpoint is sucessfully set/dropped, mark is placed/removed to left ribbon.
Debugging
You may use obvious actions for function tracing:
 Step over
 Step into
 Continue
Watching and changing Variables
While tracing, you may see variable values. Variables, that are changed from previous pause are highlighted by mark.

It is possible to change varible value, while debugging. Select row with variable and make mouse right click over variables table to show context menu.
Watching output
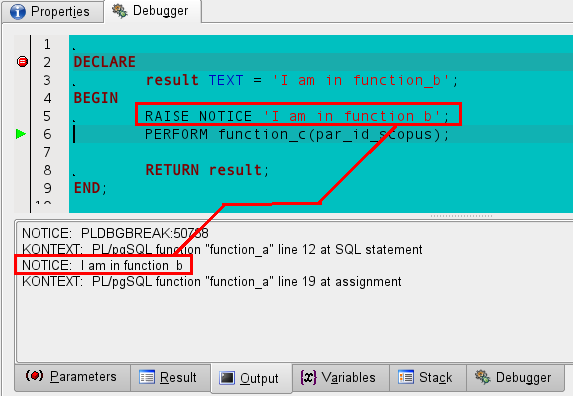
While tracing, you may see notices, sent from debugged function.
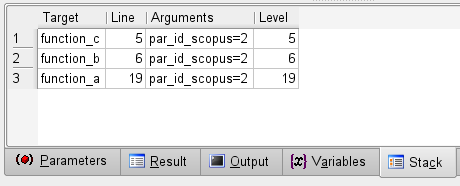
Stack
On Stack tab, you may see informations about function calling hierarchy.
Looking at result
When function is finished, result (if any), it is displayed in result area.
When table result is larger than 500 rows, only 500 rows fetched initially to table.
User may fetch another bunch of rows using
![]() Debugger -> Fetch next
Debugger -> Fetch next![]() Debugger -> Fetch all
Debugger -> Fetch all
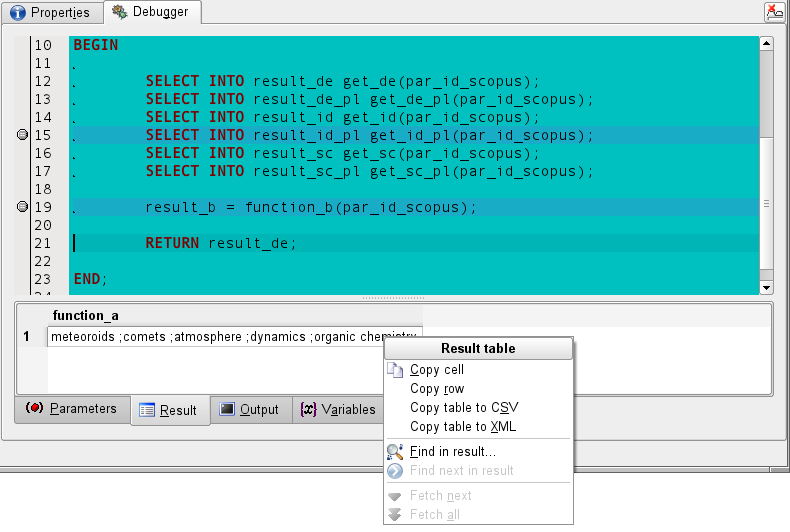
If you make mouse right-click over result table, menu containing some clipboard and search actions is displayed.
Content of result table may be saved to CSV file using File -> Export result.